- Cup of Java
- Posts
- Pandas Profiling: Generate a beautiful analytics report
Pandas Profiling: Generate a beautiful analytics report
With a single line of code, before your coffee turns cold!
Saadia Humayun
November 14, 2022
For those familiar with analysing data in Python, you all must have used pandas library extensively.
What's the first step you do to get an overview of your data? You type df.describe(), yes? And you get something like this 👇🏼

This is a bit basic and also boring for people who are big on aesthetics.
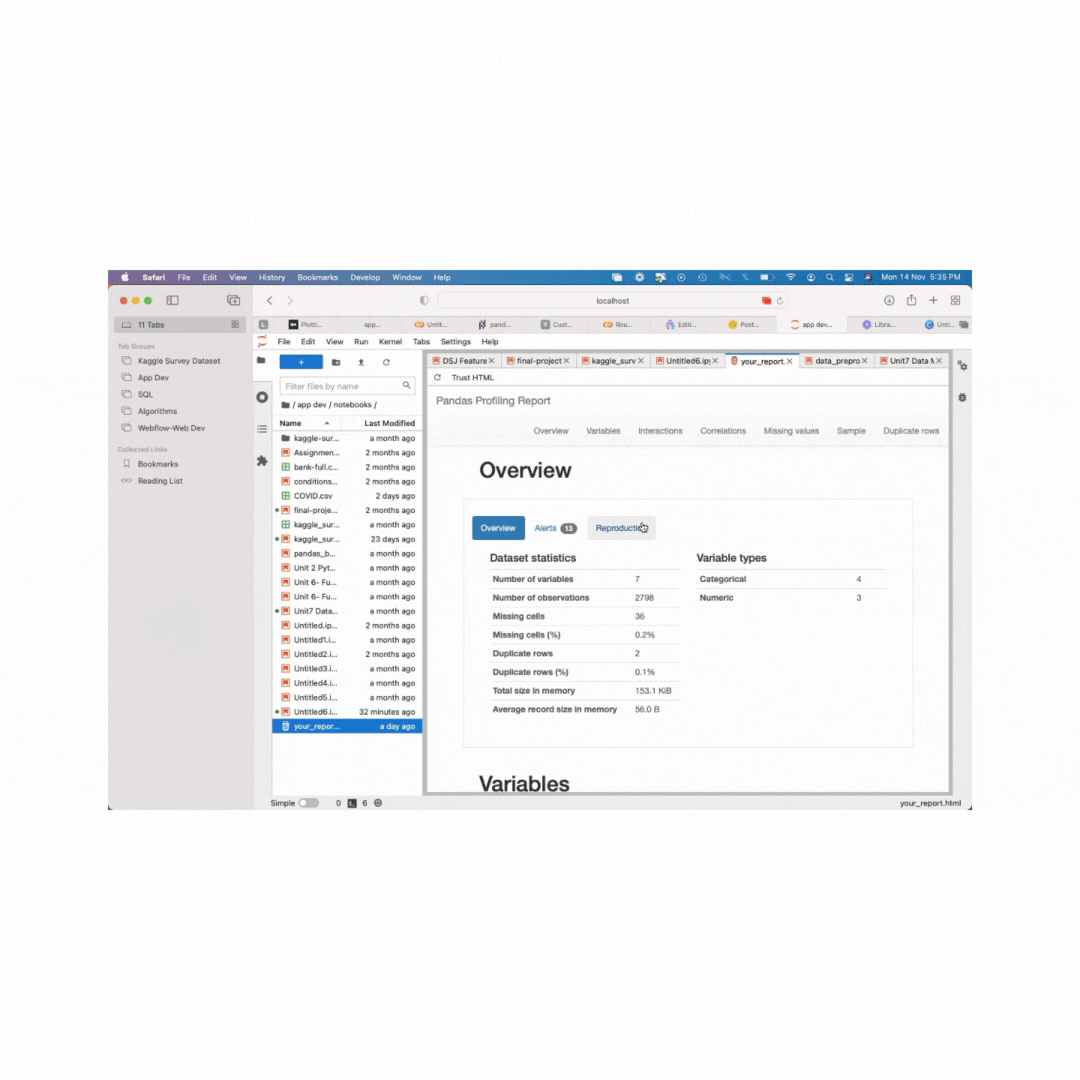
What if you can generate a report that looks like this👆🏻with just a single line of code? Let's get down to it!
Run this in your python notebook to install the package 👇🏼
pip install pandas_profiling
Import the usual libraries-->
import numpy as npimport pandas as pdfrom pandas_profiling import ProfileReport
Now, here's the one line of code you need to execute--->
pd.read_csv('COVID.csv').profile_report()
And viola! You have a detailed picture of your dataset that tells you the following:
Type inference: detect the types of columns in a DataFrame
Essentials: type, unique values, indication of missing values
Quantile statistics: minimum value, Q1, median, Q3, maximum, range, interquartile range
Descriptive statistics: mean, mode, standard deviation, sum, median absolute deviation, coefficient of variation, kurtosis, skewness
Most frequent and extreme values
Histograms: categorical and numerical
Correlations: high correlation warnings, based on different correlation metrics (Spearman, Pearson, Kendall, Cramér’s V, Phik)
Missing values: through counts, matrix, heatmap and dendrograms
Duplicate rows: list of the most common duplicated rows
Text analysis: most common categories (uppercase, lowercase, separator), scripts (Latin, Cyrillic) and blocks (ASCII, Cyrilic)
File and Image analysis: file sizes, creation dates, dimensions, indication of truncated images and existence of EXIF metadata
To export your report:
profile=pd.read_csv('COVID.csv').profile_report()
profile.to_file("your_report.html")
Report themes and colors can be customised. Read the documentation here.
This is it for now! I hope this makes your analysis easier and faster. Have fun playing with your data!