- Cup of Java
- Posts
- Interactive Plots with Pandas
Interactive Plots with Pandas
One line of code to rule them all, one code to plot them, one library to chart them all, and in the darkness glorify them.
Saadia Humayun
December 01, 2022
One line of code to rule them all, one code to plot them, one library to chart them all, and in the darkness glorify them.
I simply couldn't resist to twist the quote. Anyway...
Did you know that creating interactive visualisations with the pandas plot() function is extremely simple? Yes, I know you're thinking plotly. And you're on the right track.
But this is different. Instead of importing plotly library and its components, and writing a completely different syntax for your plots, you can still get the plotly looks and interactivity with your pandas plot functions without changing anything.
All you have to do is set the backend parameter to plotly and get an interactive plot, instead of the standard Matplotlib figure!
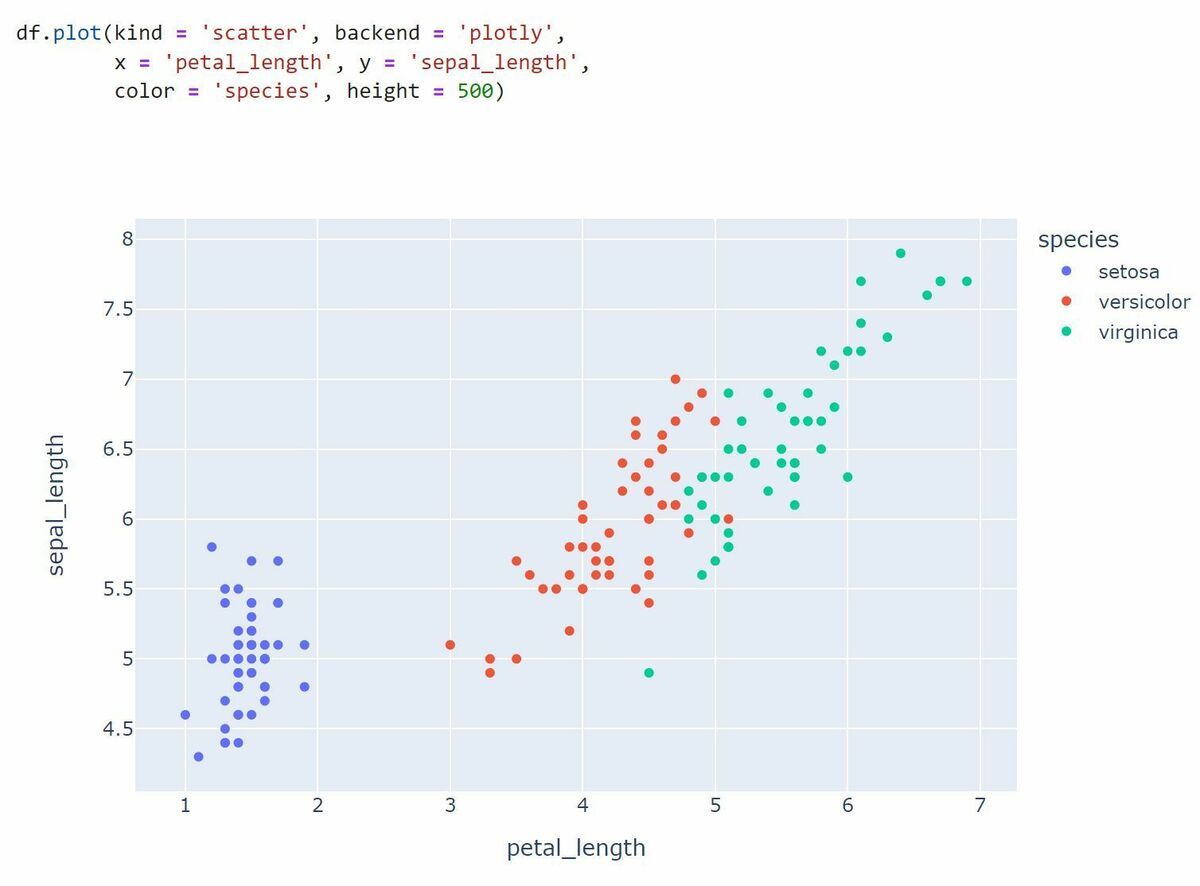
In the following example, I used the Plotly backend to create a scatter plot of the famous Iris dataset, specifically the sepal length and petal length.
This is a useful feature, which could be handy, when performing exploratory data analysis. Moreover, to update panda’s plotting backend globally for a particular session use:
import pandas as pdpd.options.plotting.backend = "plotly"
Now you won't even need to include backend = "plotly" in your plot functions every time you want to visualise the dataset.
That’s it! Your notebook will now generate interactive plotly visualisations from pandas commands.
Happy plotting!