- Cup of Java
- Posts
- Weekday Breakfast: Coffee and Donut!
Weekday Breakfast: Coffee and Donut!
A perky donut chart to liven up your next presentation!
Let's bake some donuts in javascript today!
What's better than coffee?
A donut to go with it.
As promised, here's a low code, beginner friendly guide to creating a fun, interactive, hand-drawn sketch of a donut chart that actually shows real data!
We will be using Roughviz, a really cool javascript library (in Python) to build the visualisation. So let's get started!
What you need:
An internet connection
Google Colab account/ Kaggle notebook/ Jupyter notebook - any would do
The data file (coffee-donut1.csv) which you can download from here
If you've never coded in your life, but really want to chow down on this donut, then follow along. It's super easy!
The Process-->
Open Colab or your python environment of choice. Install and import the library contents.

Next, upload the data file (coffee-donut1.csv) to your Colab session storage.

Now let's read in the data-->

You will get something like this-->

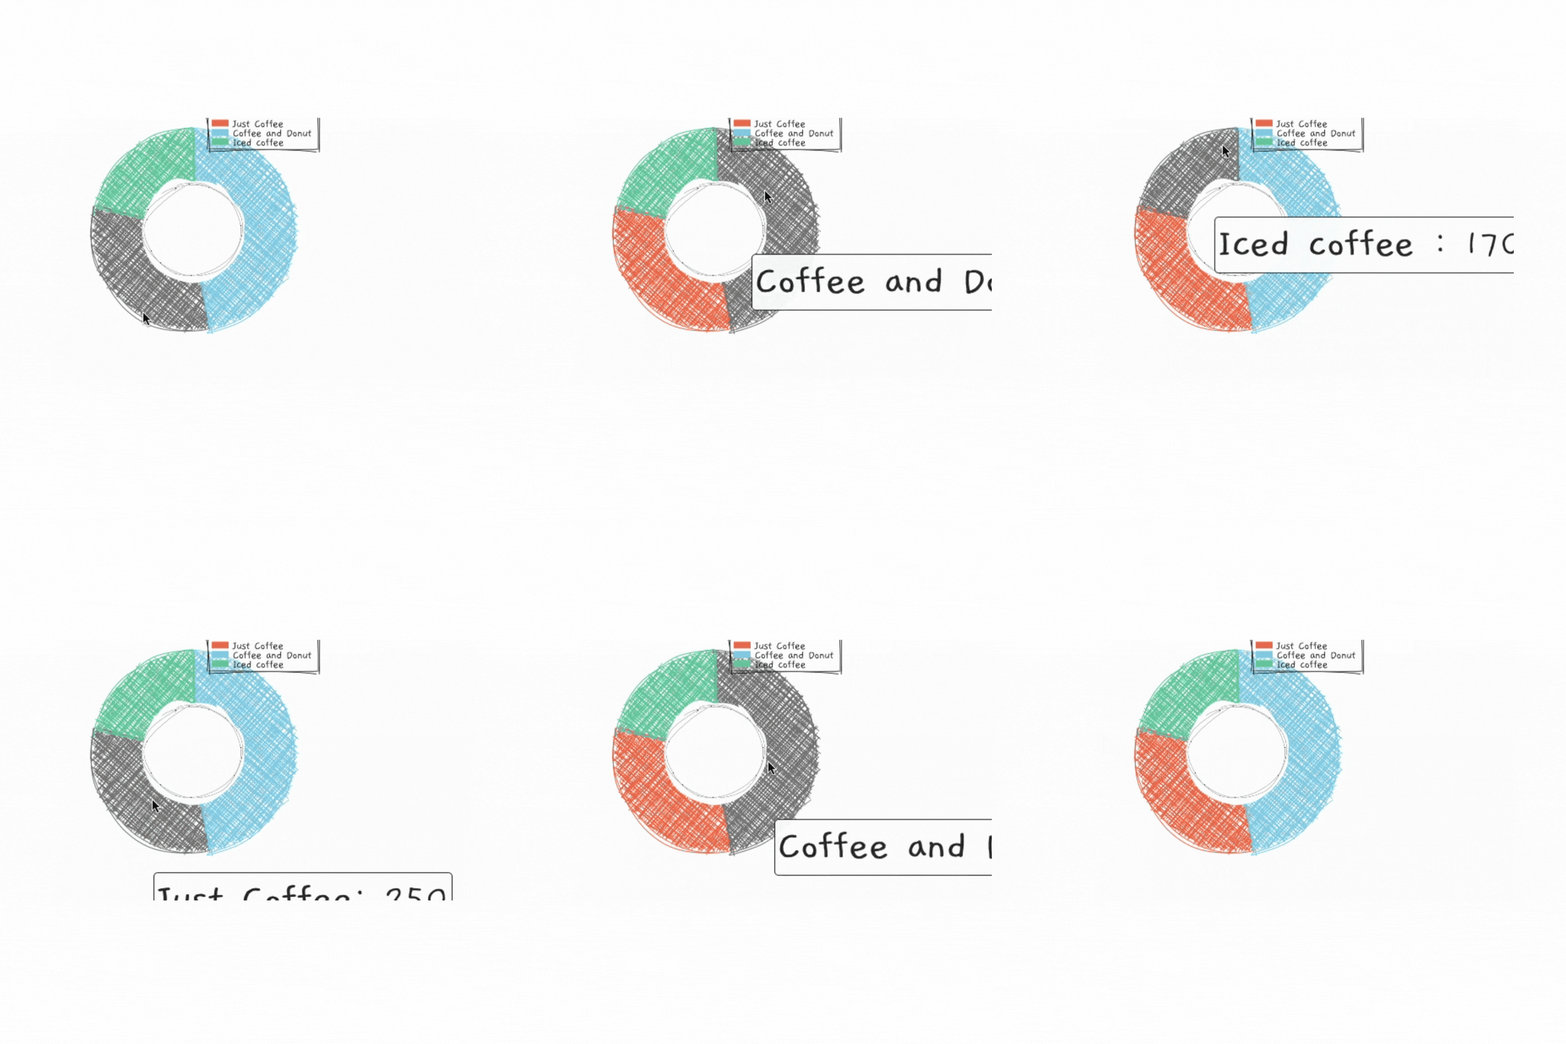
Now let's type in the code for the donut chart-->

Ta-da! Here's your donut!

While you play around with this, I'll do a deep dive into Roughviz library for more of these cool visuals you can use as bar charts, line graphs, pie charts and the likes!Happy experimenting!Oh, and here's the link to my Colab notebook!